Plots for a pkbc object.
Usage
# S4 method for pkbc,ANY
plot(x, k = NULL, true_label = NULL, pca_res = FALSE, ...)
Arguments
- x
Object of class
pkbc- k
number of considered clusters. If it is not provided the scatter plot is displayed for each value of number of clusters present in the
xobject- true_label
factor or vector of true membership to clusters (if available). It must have the same length of final memberships.
- pca_res
Logical. If TRUE the results from PCALocantore are also reported (when dimension is greater than 3).
- ...
Additional arguments that can be passed to the plot function
Details
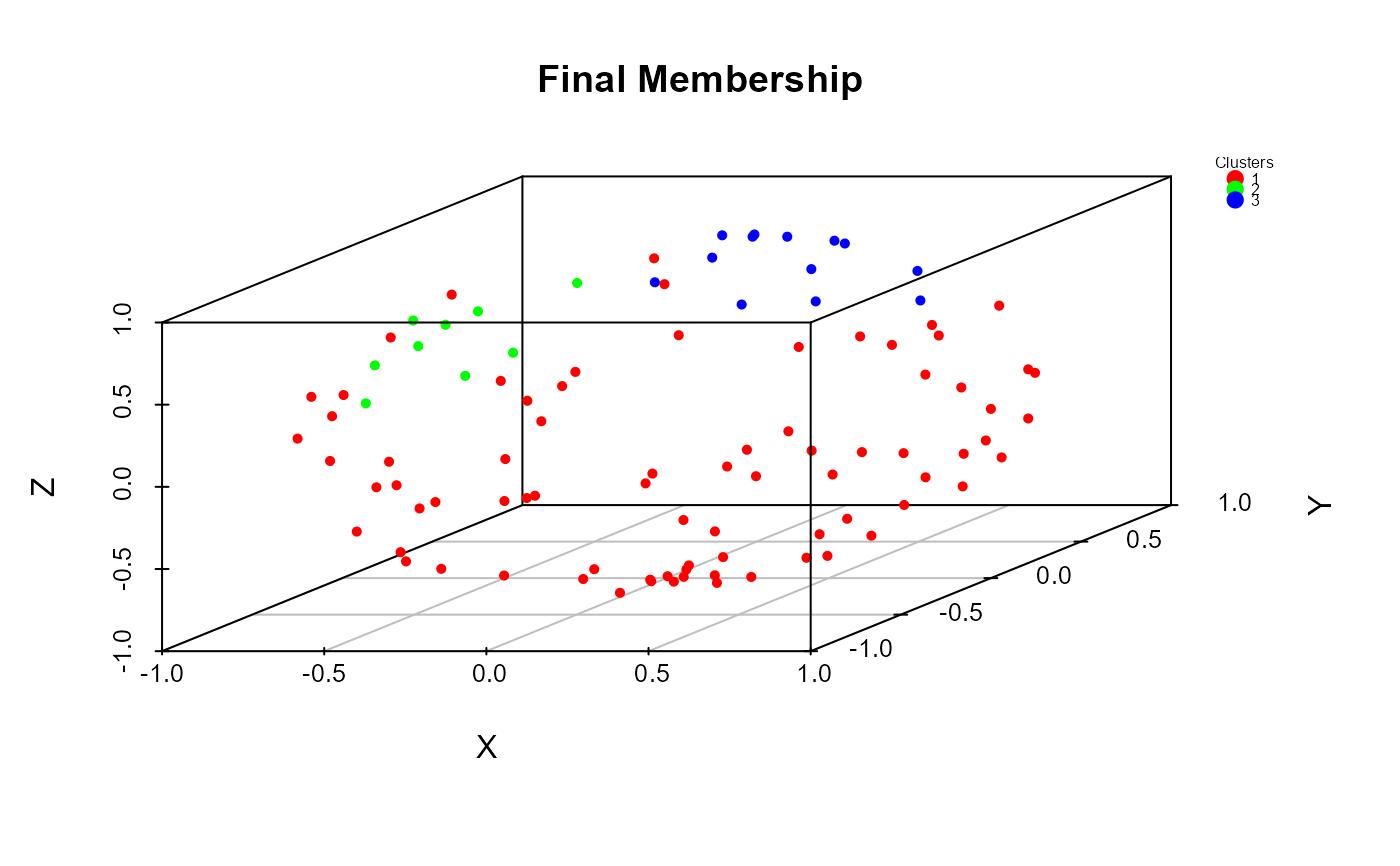
scatterplot: If dimension is equal to 2 or 3, points are displayed on the circle and sphere, respectively. If dimension if greater than 3, the spherical Principal Component procedure proposed by Locantore et al. (1999), is applied for dimensionality reduction and the first three principal components are normalized and displayed on the sphere. For d > 3, the complete results from the
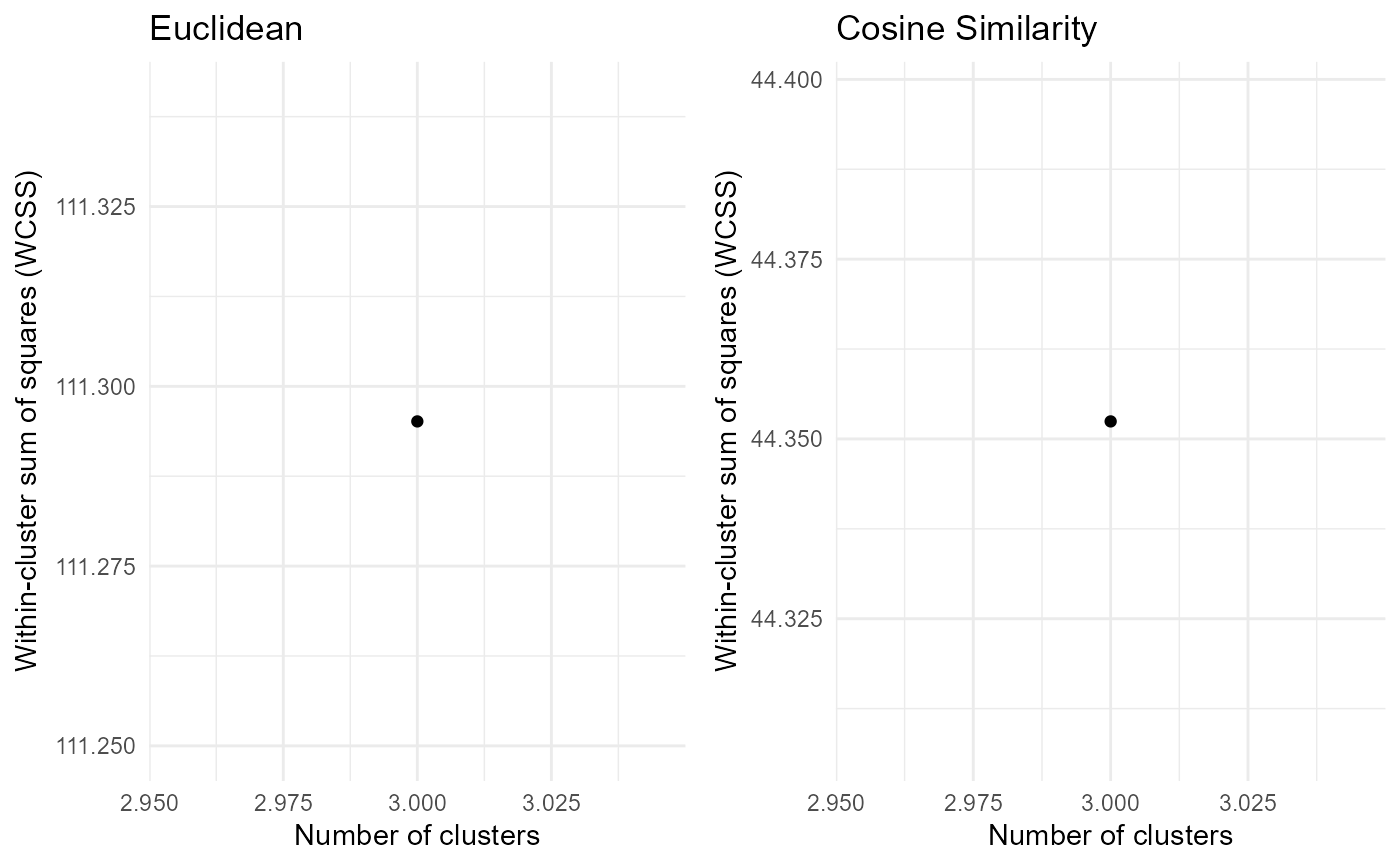
PcaLocantorefunction (packagerrcov) are returned ifpca_res=TRUE.elbow plot: the within cluster sum of squares (wcss) is computed using the Euclidean distance (left) and the cosine similarity (right).
Note
The elbow plot is commonly used as a graphical method for choosing the appropriate number of clusters. Specifically, plotting the wcss versus the number of clusters, the suggested number of clusters correspond to the point in which the plotted line has the greatest change in slope, showing an elbow.
References
Locantore, N., Marron, J.S., Simpson, D.G. et al. (1999) "Robust principal component analysis for functional data." Test 8, 1–73. https://doi.org/10.1007/BF02595862